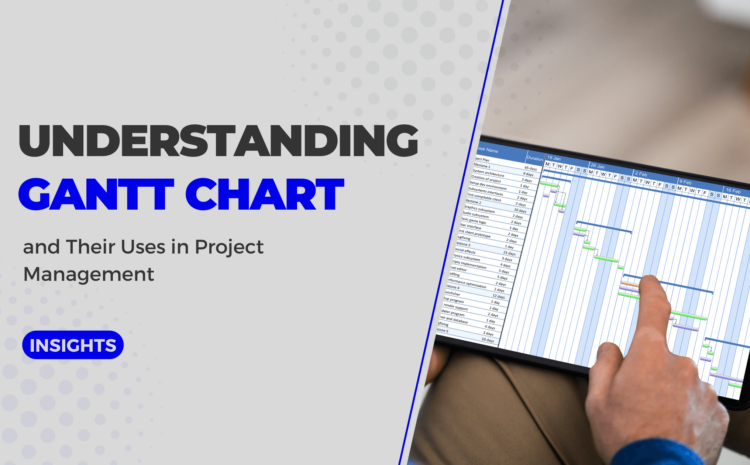
Gantt Charts are an important tool for project management, allowing you to track progress, resources, deadlines and tasks in one place. In this article, we will discuss the definition, uses, and limitations of Gantt Charts, as well as discuss some examples and the role time-tracking software plays in using them successfully.
A Gantt chart is a type of bar chart that is commonly used in project management to represent the schedule of tasks in a project. It is named after Henry Gantt, an American engineer and management consultant who developed the chart around the 1910s.
A Gantt chart typically consists of a horizontal axis that represents the time scale of the project, and a vertical axis that lists the tasks of the project. Each task is represented by a horizontal bar that spans the duration of the task, and the bars are arranged in the order in which the tasks will be completed.
Gantt charts are a powerful tool for project managers, allowing for easy tracking of the progress and milestones of a project. They not only provide a visual representation of the timeline and tasks associated with it but can also be used to track the progress of each task within the timeline. As such, Gantt charts are an invaluable tool for effective project management and time tracking.
They also offer flexibility when it comes to creating project timelines and planning out tasks, as well as providing insights into how long each task will take to complete. Additionally, Gantt charts can be used in conjunction with other time-tracking software such as Microsoft Project or Officio.work, making it even easier to manage complex projects on tight deadlines.
Suitable for Beginners
Gantt charts are a suitable tool for beginners in project management because they provide a clear and visual representation of a project schedule. They can be used to:
- Understand the overall structure of a project
- See the dependencies between tasks
- Identify the start and end date of a project
- Track the progress of a project
Additionally, many project management software or digital workplace like Officio.work has a built-in Gantt chart feature, which makes it easy to create and manage Gantt charts even for beginners. Officio.work has a user-friendly interface which makes it easy to understand and use the Gantt chart feature.
Limitations
As much as it is useful, Gantt charts do have some limitations, particularly for large and complex projects. Some of the limitations include:
a. Limited detail: Gantt charts are a high-level view of a project schedule and do not provide detailed information about each task.
b. Lack of flexibility: Gantt charts are best suited for projects with a clear start and end date and a linear sequence of tasks. They may not be as effective for projects with multiple parallel tasks or a non-linear structure.
c. Difficulty in representing dependencies: Gantt charts can be difficult to read when there are a lot of dependencies between tasks, which can make it challenging to understand the relationships between tasks.
d. Limited ability to handle changes: Gantt charts are not well suited for projects with a lot of changes or uncertainty, as it can be challenging to update the chart and communicate the changes to stakeholders.
Because of these limitations, Gantt charts are often used in combination with other project management tools and techniques, such as the critical path method, PERT chart, mind map, etc to get a more comprehensive view of the project schedule and progress. However, in Officio.work, we incorporate simple-to-use collaboration and real-time updates together with Gantt Chart and Kanban Board usage in the project management dashboard.
Relevance
Though it has been invented in the 1910s, Gantt charts are still widely used and relevant in project management today. They provide a simple and easy-to-understand visual representation of a project schedule and are a standard tool for project management.
While Gantt charts have some limitations, as discussed earlier, they are still considered to be valuable tools for project managers. They can be used to:
- Communicate the project schedule to stakeholders
- Track the progress of a project
- Identify potential schedule conflicts or dependencies between tasks
- Make adjustments to the schedule as needed
Additionally, the use of project management software like Officio.work has made it easy to create and manage Gantt charts, which has made them more accessible to users.
It’s worth noting that Gantt charts are not the only tool available for project management and different projects have different needs and requirements. Therefore, it’s important to evaluate the suitability of the Gantt chart for a specific project, and use it in combination with other project management tools and techniques to get a more comprehensive view of the project schedule and progress.